Google クラウド プラットフォームのモニタリング
LogicMonitor は、GCE、GAE、CloudSQL などのすべての GCP サービスをリアルタイムで自動的に検出して監視します。 当社の包括的なカバレッジは、ネットワーク、サーバー、またはコンテナ サービスとともに GCP メトリクスを提供し、完全にデプロイされているか、開始したばかりかにかかわらず、正常性とパフォーマンスを完全に可視化します。 ハイブリッドおよびマルチクラウド環境を採用する大規模な組織向けに設計された LogicMonitor のエージェントレス アーキテクチャを使用して、簡単に拡張できます。
コラボレーション、コミュニケーション、自動化のより良い方法
簡単な導入、さらに簡単な構成
LogicMonitor の GCP モニタリングは、既存のダッシュボード、アラート、レポート、予測機能とシームレスに統合されるため、ハイブリッド インフラストラクチャ全体のデータを視覚化できます。 LogicMonitor の軽量でエージェントレスのコレクターを使用すると、ダッシュボード、アラートのしきい値、および予測をすべて展開から数分で作成できます。 さらに、GCP 環境が変化すると、LogicMonitor は新しいリソースや変化するリソースを手動で構成することなく迅速に認識します。
過去、現在、未来の環境全体を XNUMX か所で監視
LogicMonitor を使用すると、既存の監視対象インフラストラクチャとともにクラウド サービスを包括的に監視できるため、ハイブリッド インフラストラクチャのパフォーマンス全体をエンド ツー エンドで把握できます。 GCP インフラストラクチャの健全性とパフォーマンス、およびオペレーティング システム、ネットワーク、サーバー、アプリケーションの包括的な可視性を、他の方法では取得が困難な単一のプラットフォームで取得します。
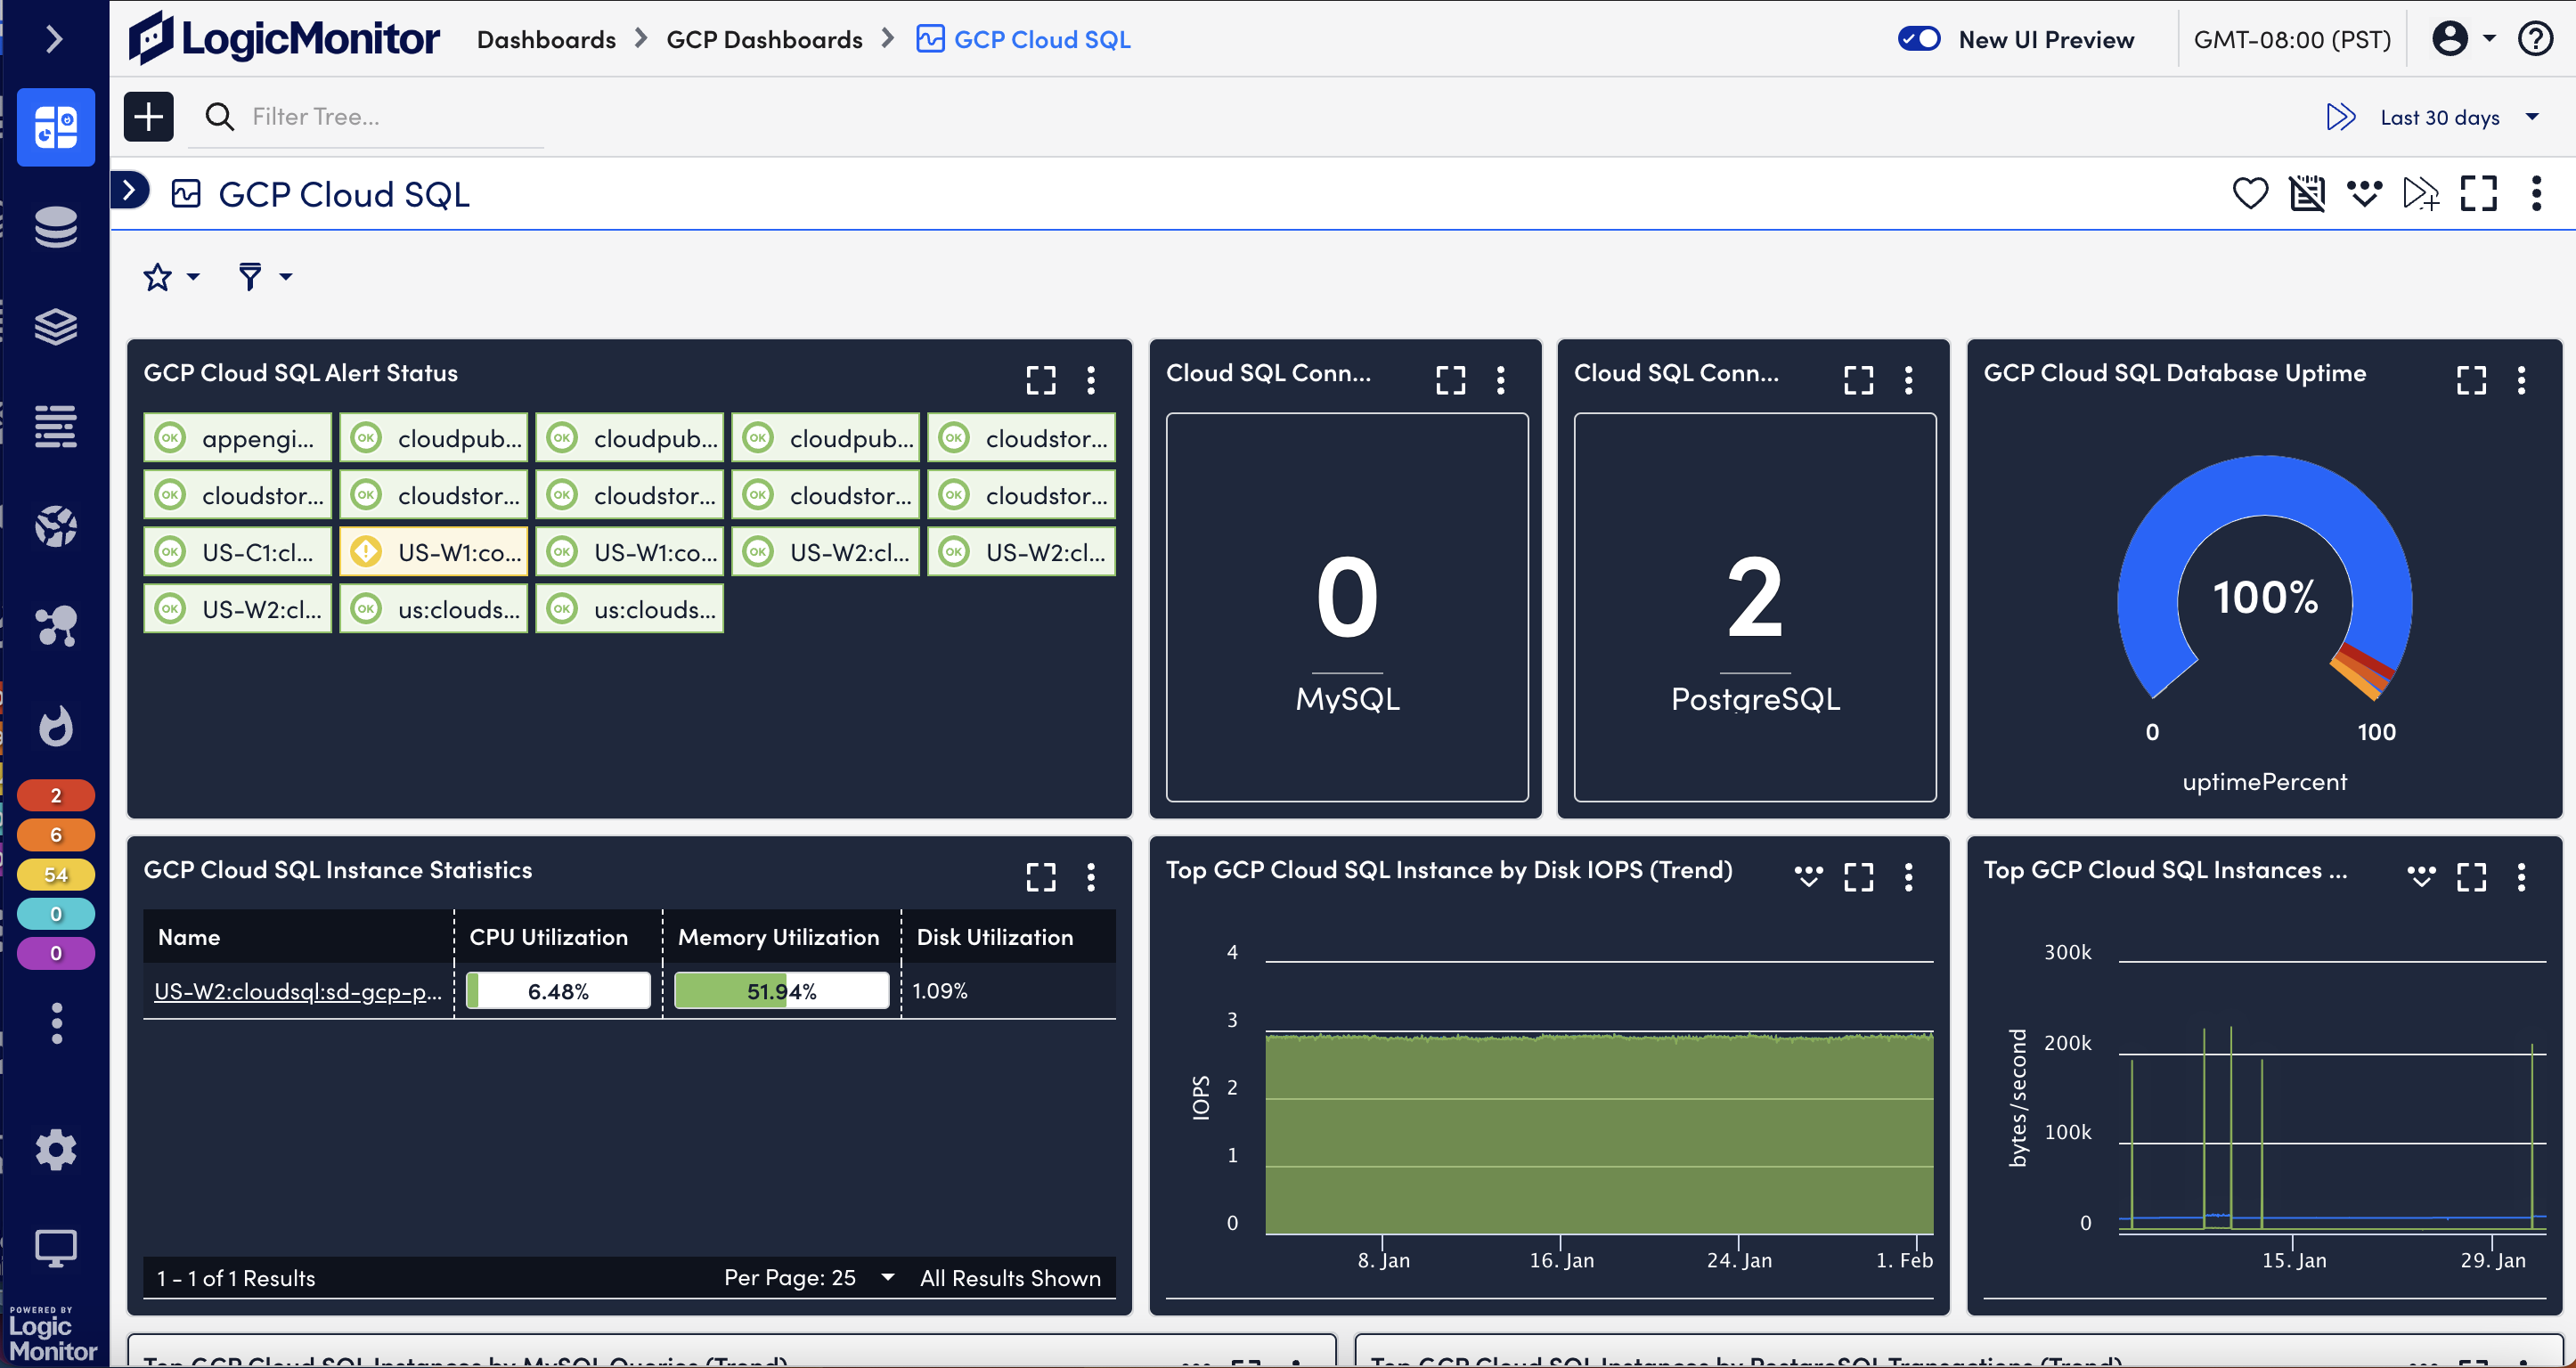
実用的なデータを適切なタイミングで適切な手に渡す
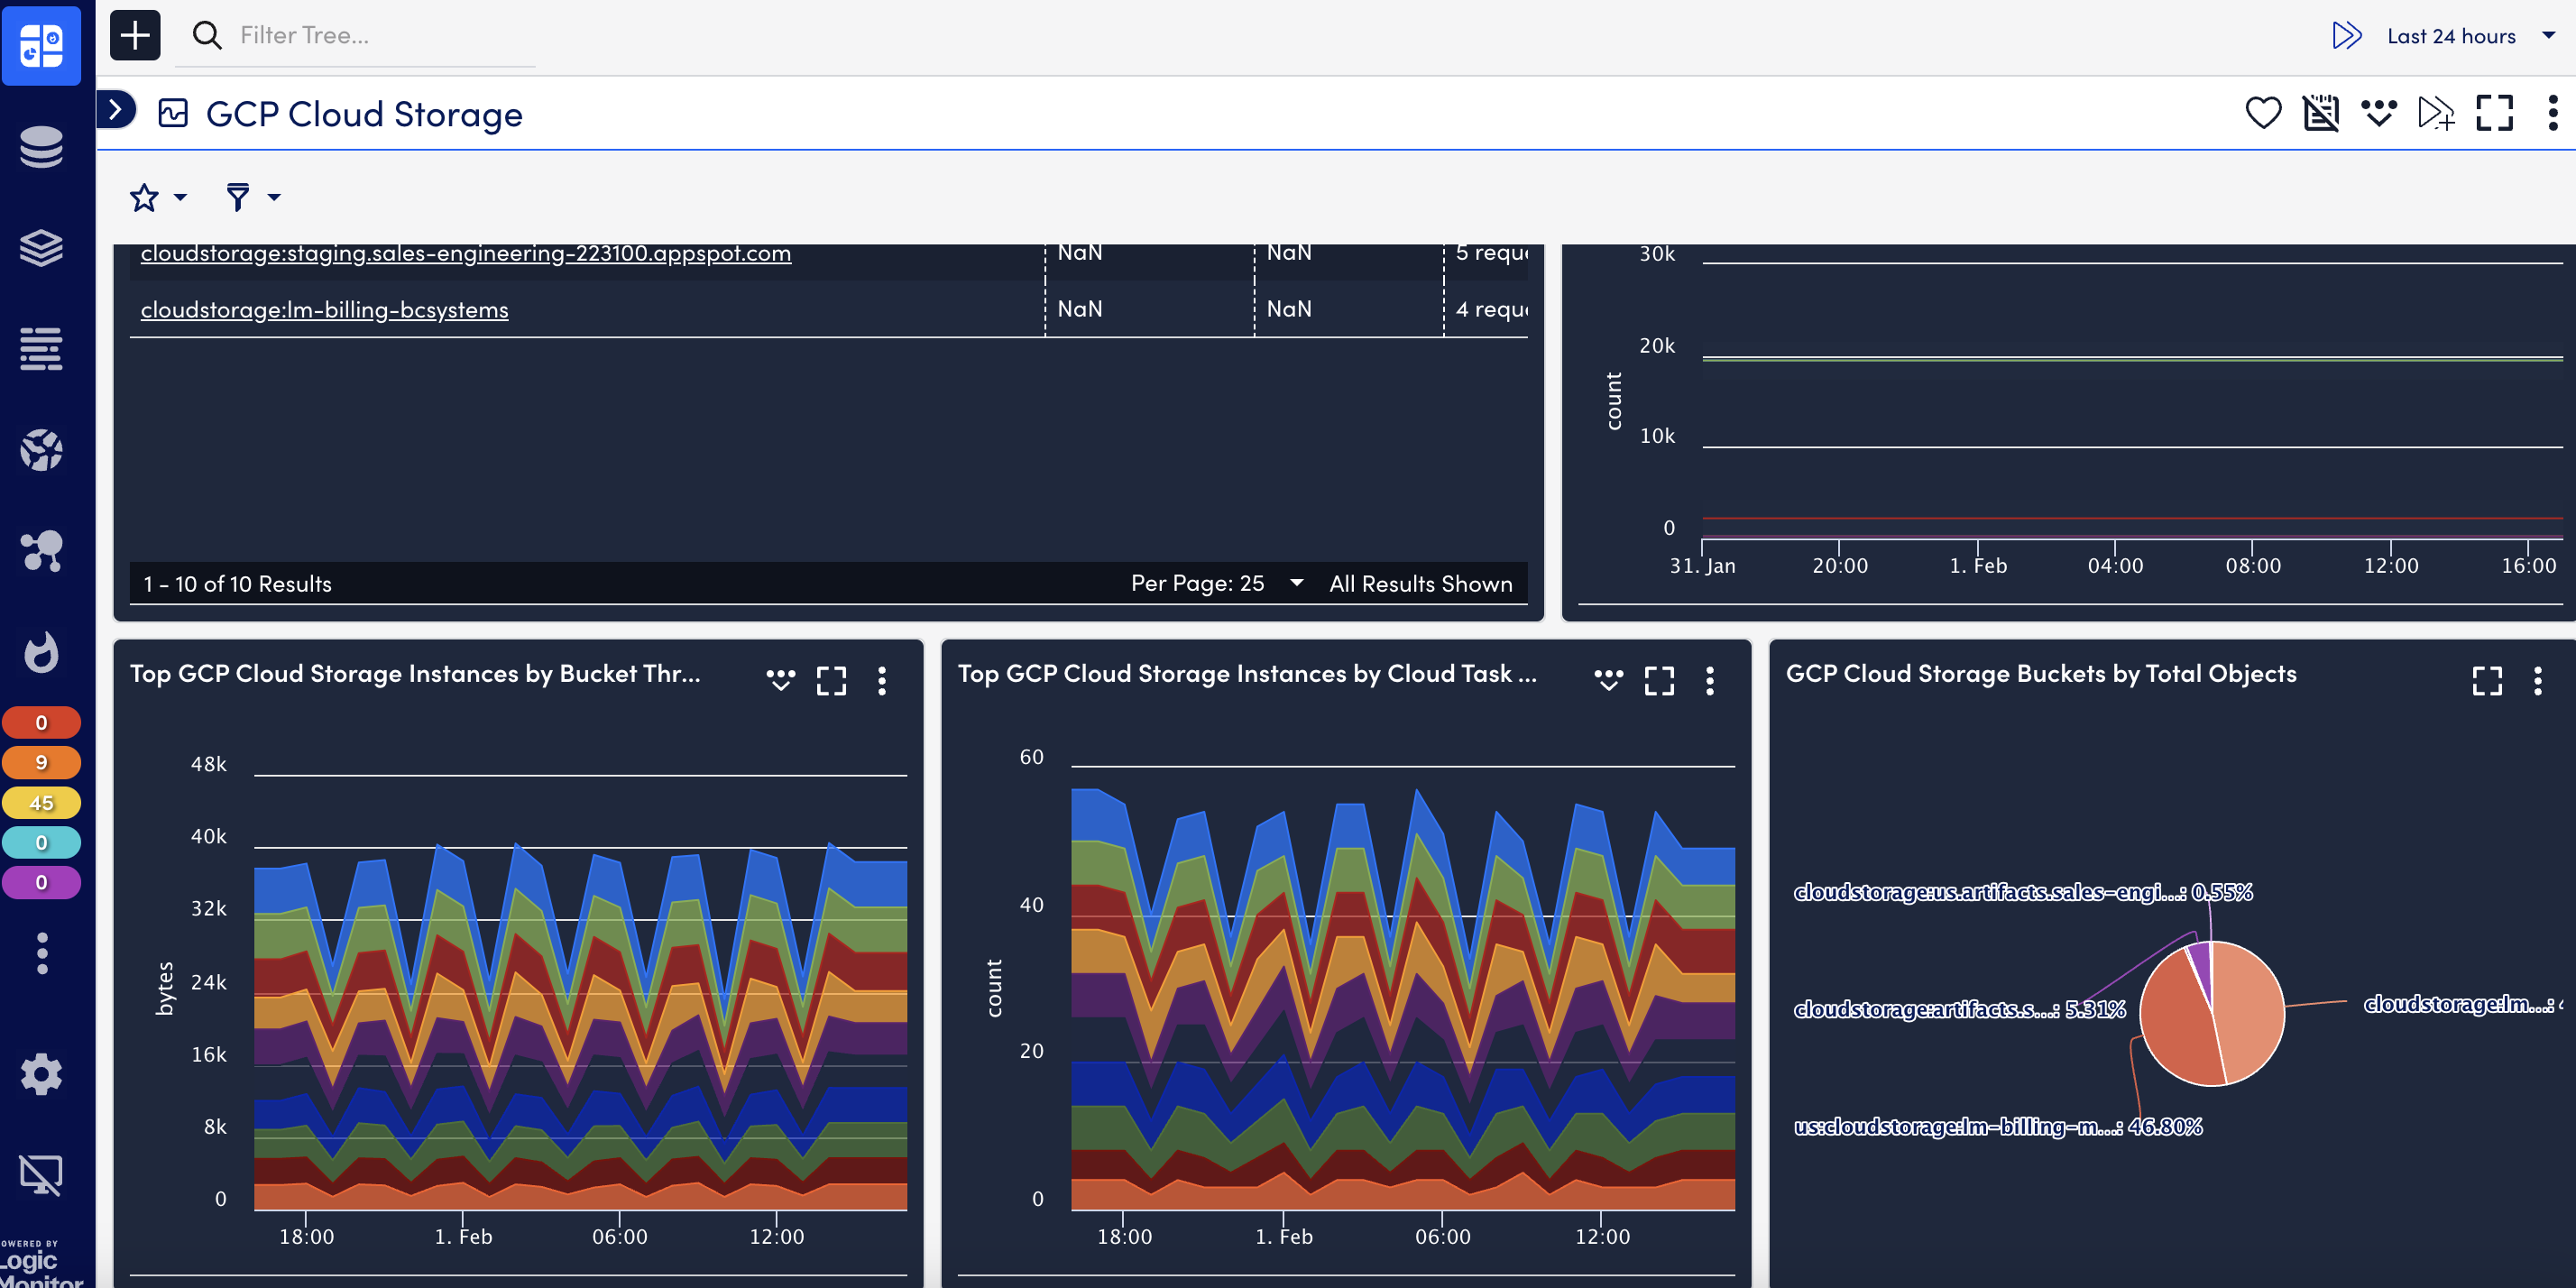
ファイル ストレージ、メッセージングとキューイング、データ ストレージのいずれであっても、リアルタイムの可視性が重要です。 LogicMonitor は、Filestore、Cloud Storage、Redis、Pub/Sub、SQL、BigTable などの GCP のデータ ニーズを関連付けて提示するため、ユーザーはデータの行き先を把握できます。
let scrollerHeight = 0;
const mediaWrap = wrap.querySelector('.active .lm-content-benefits-horizontal-scroller__tab__media__wrap'); const itemWidth = mediaWrap.offsetWidth;
tabs.forEach(tab => { const image = tab.querySelector('.lm-content-benefits-horizontal-scroller__tab__media__wrap > *');
let imageWidth; let imageHeight; if(image) { if(image.tagName === 'IMG' ){ imageWidth = image.attributes.width.value; imageHeight = image.attributes.height.value; } if(image.tagName === 'VIDEO' ){ imageWidth = image.offsetWidth; imageHeight = image.offsetHeight; } const actualHeight = (itemWidth * imageHeight) / imageWidth; if(scrollerHeight { // tab.querySelector('.lm-content-benefits-horizontal-scroller__tab__media__wrap').style.height = scrollerHeight + 'px'; // });
function buttonHandler(e) { buttons.forEach((button) => { button.classList.remove('active'); if (e.target === button) { button.classList.add('active'); } }) tabs.forEach((tab) => { tab.classList.remove('active'); if (tab.dataset.tab === e.target.dataset.tab) { tab.classList.add('active'); } }) select.value = e.target.dataset.tab; }
buttons.forEach((button) => { button.addEventListener('click', buttonHandler); })
function selectHandler(e) { tabs.forEach((tab) => { tab.classList.remove('active'); if (tab.dataset.tab === e.target.value) { tab.classList.add('active'); } }) buttons.forEach((button) => { button.classList.remove('active'); if (e.target.value === button.dataset.tab) { button.classList.add('active'); } }) }
select.addEventListener('input', selectHandler); }());
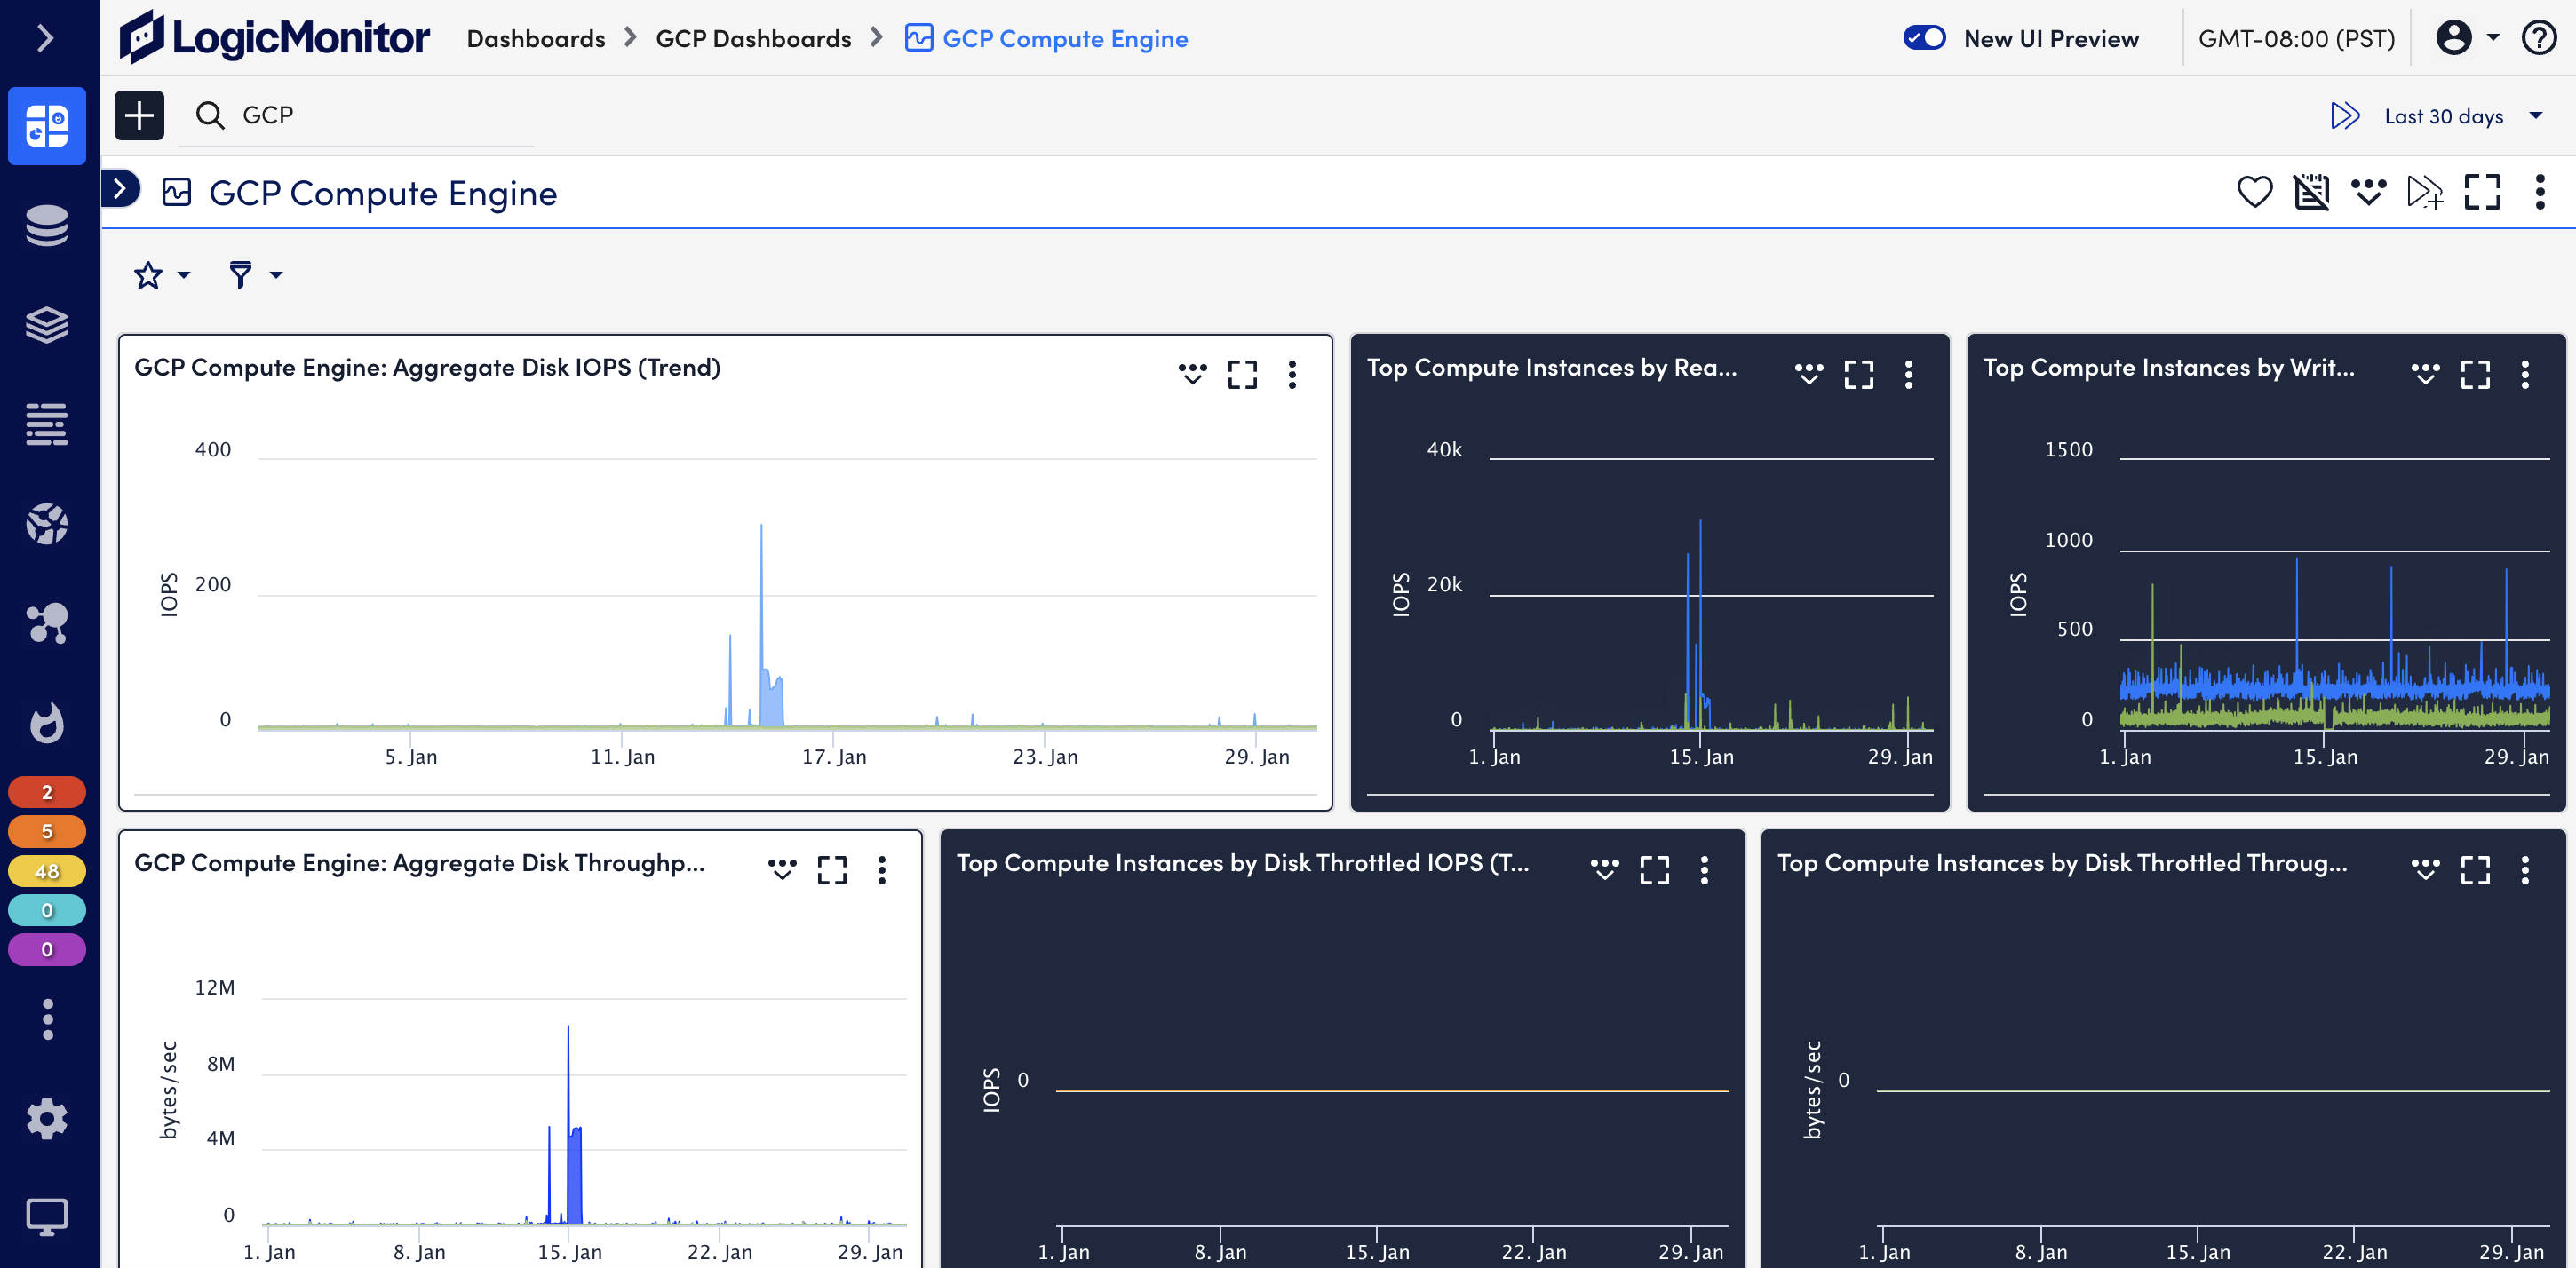
GCP チームの新しい親友
サービスに影響を与える可能性のある GCP の問題が発生した場合は、最初に知る必要があります。 LogicMonitor は、GCP 環境の Stackdriver 指標を監視するだけでなく、GCP を完全に可視化するためにカスタム指標を監視します。 これにより、LogicMonitor は詳細なリソース パフォーマンス、GCP の可用性 (GCP が課すサービス制限または定期メンテナンスによるものかどうか)、および重要なアプリケーションまたは OS レベルのメトリックについて、箱から出してすぐにレポートできます。
// 最初のリダイレクト window.location.href = '/resources/thank-you-for-downloading?url_content_id=412673&form=no&content_type=&content_title=Google+Cloud+Platform&content_dl_link=';
// リダイレクト後にダウンロードを開始します setTimeout(function() { var fileUrl = ”; var fileName = fileUrl.split('/').pop(); var xhr = new XMLHttpRequest(); xhr.responseType = 'blob'; xhr.onload = function() { var a = document.createElement('a'); var blob = xhr.response; a.href = window.URL.createObjectURL(blob); a.download = fileName; document.body.appendChild(a); a.click(); document.body.removeChild(a); }; xhr.open('GET', fileUrl); xhr.send(); }, 1000); // 必要に応じてタイムアウトを調整します }); } });
リモート ワーカーがビートを逃さないようにする
当社のエージェントレス プラットフォームは、すぐに使える統合とダッシュボード ウィジェットを提供し、重要な在宅勤務ソリューションを可視化します。 当社のインテリジェントな監視は、リモート ワーカーがビジネス パフォーマンスを促進し、カスタマー エクスペリエンスを維持していることを確認するのに役立ちます。 LogicMonitor を使用すると、VPN トンネルごとに GCP VPN ゲートウェイの Stackdriver 指標を簡単にモニタリングできます。
// 最初のリダイレクト window.location.href = '/resources/thank-you-for-downloading?url_content_id=412673&form=no&content_type=&content_title=Google+Cloud+Platform&content_dl_link=';
// リダイレクト後にダウンロードを開始します setTimeout(function() { var fileUrl = ”; var fileName = fileUrl.split('/').pop(); var xhr = new XMLHttpRequest(); xhr.responseType = 'blob'; xhr.onload = function() { var a = document.createElement('a'); var blob = xhr.response; a.href = window.URL.createObjectURL(blob); a.download = fileName; document.body.appendChild(a); a.click(); document.body.removeChild(a); }; xhr.open('GET', fileUrl); xhr.send(); }, 1000); // 必要に応じてタイムアウトを調整します }); } });
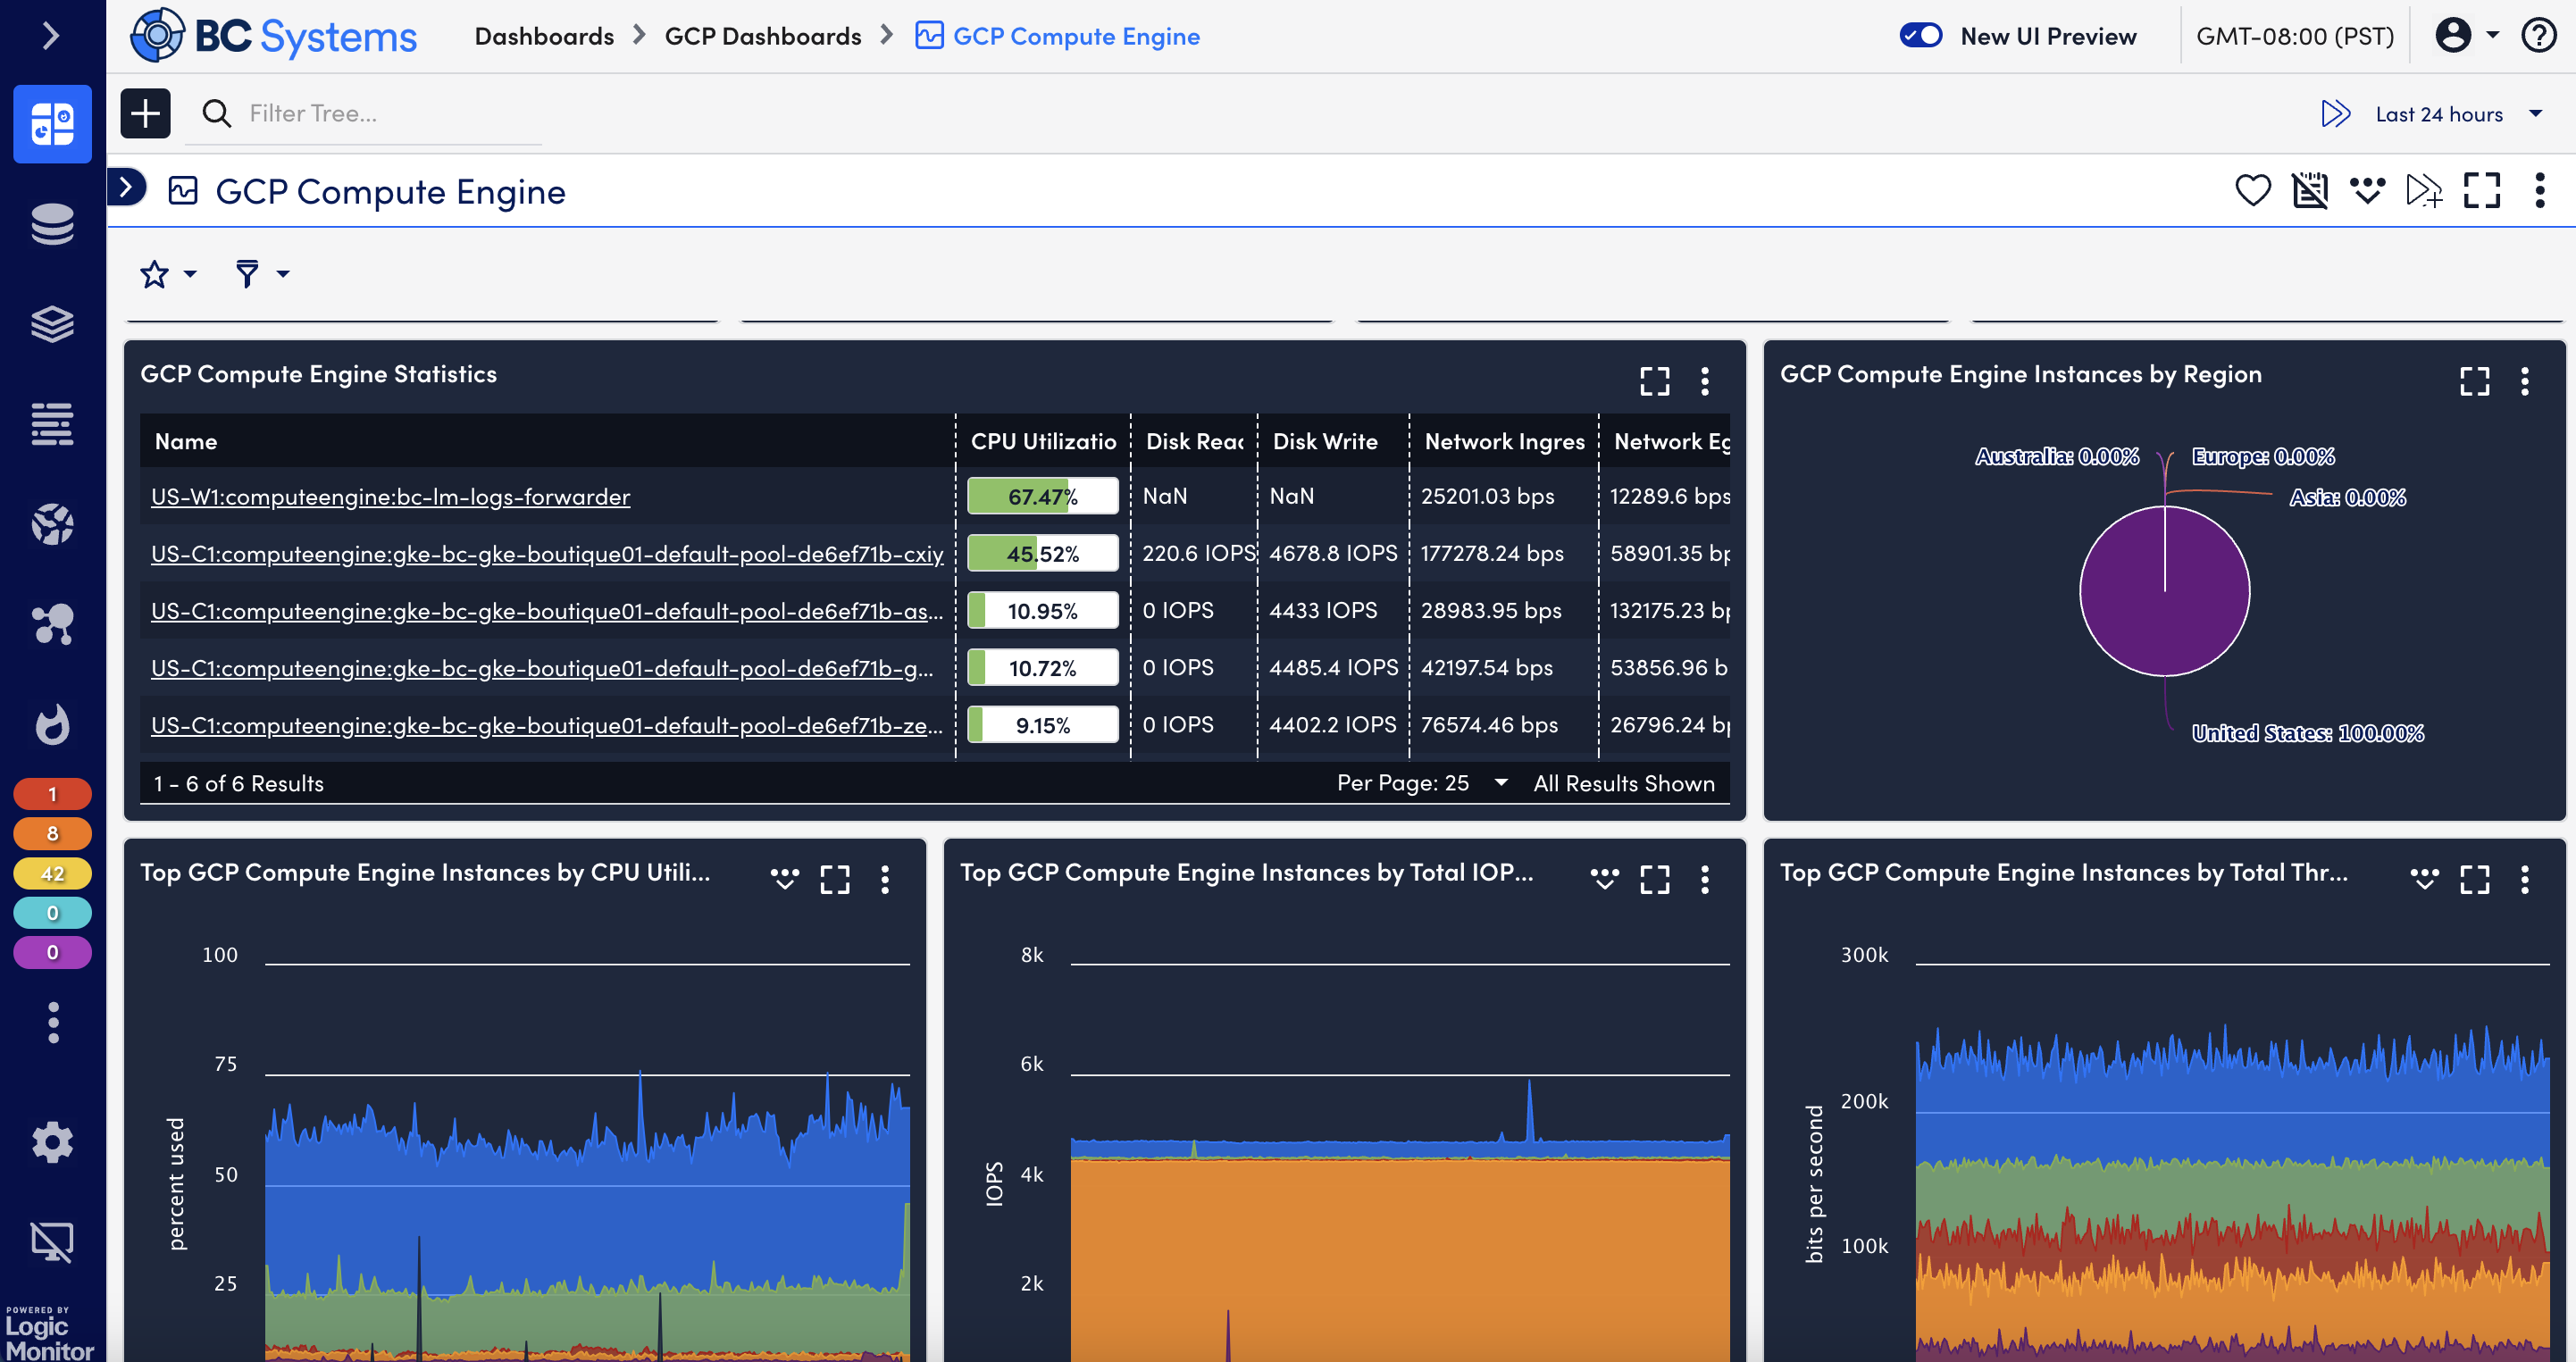
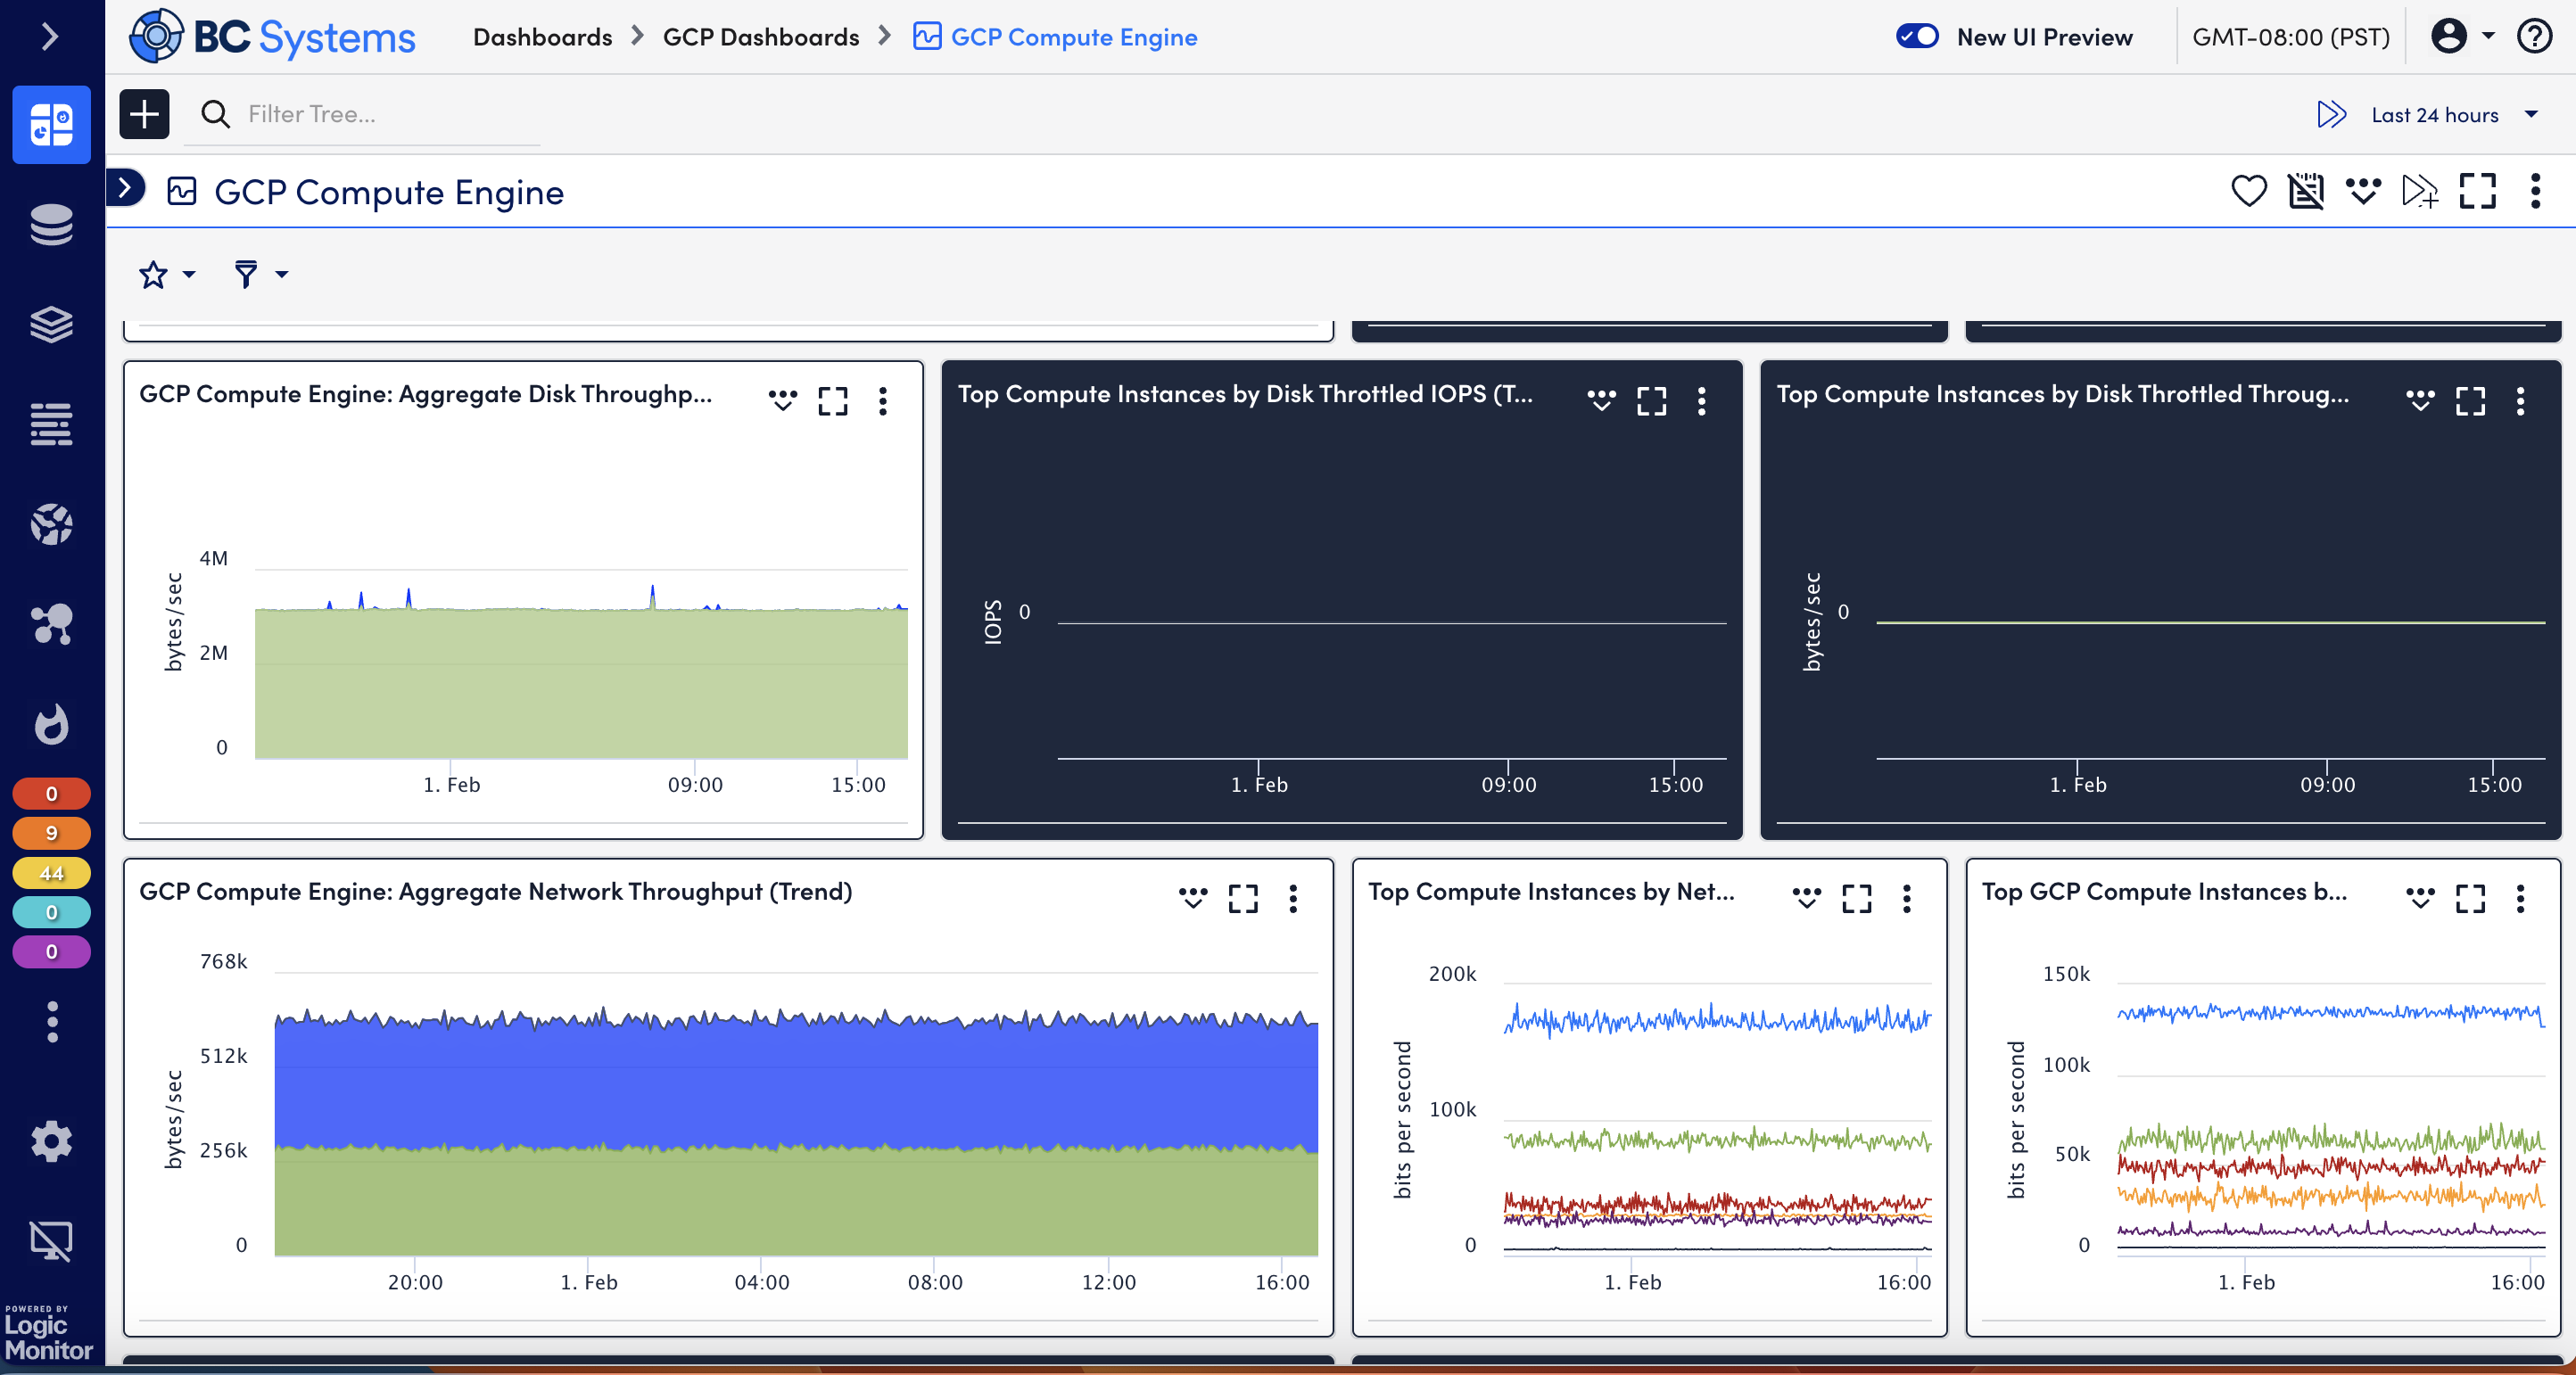
GCP の Compute Engine が気に入った場合は、それも監視できます
LogicMonitorは、GCP StackDriverAPIを介してComputeEngineのモニタリングを提供します。 より高度なすぐに使用できる指標の場合、ローカルコレクターを追加すると、各ComputeEngineインスタンスで実行されているもののパフォーマンスについての理解が自動的に高まります。
// 最初のリダイレクト window.location.href = '/resources/thank-you-for-downloading?url_content_id=412673&form=no&content_type=&content_title=Google+Cloud+Platform&content_dl_link=';
// リダイレクト後にダウンロードを開始します setTimeout(function() { var fileUrl = ”; var fileName = fileUrl.split('/').pop(); var xhr = new XMLHttpRequest(); xhr.responseType = 'blob'; xhr.onload = function() { var a = document.createElement('a'); var blob = xhr.response; a.href = window.URL.createObjectURL(blob); a.download = fileName; document.body.appendChild(a); a.click(); document.body.removeChild(a); }; xhr.open('GET', fileUrl); xhr.send(); }, 1000); // 必要に応じてタイムアウトを調整します }); } });
Kubernetes を使用しない GCP モニタリングとは
ダウンタイムを予防的に防ぎ、アプリケーションのパフォーマンスを最大化するには、GKE にデータが必要です。 LogicMonitor の Kubernetes Monitoring を使用すると、ハイブリッド インフラストラクチャの残りの部分に関する重要な洞察とともに、GKE の洞察を得ることができます。
// 最初のリダイレクト window.location.href = '/resources/thank-you-for-downloading?url_content_id=412673&form=no&content_type=&content_title=Google+Cloud+Platform&content_dl_link=';
// リダイレクト後にダウンロードを開始します setTimeout(function() { var fileUrl = ”; var fileName = fileUrl.split('/').pop(); var xhr = new XMLHttpRequest(); xhr.responseType = 'blob'; xhr.onload = function() { var a = document.createElement('a'); var blob = xhr.response; a.href = window.URL.createObjectURL(blob); a.download = fileName; document.body.appendChild(a); a.click(); document.body.removeChild(a); }; xhr.open('GET', fileUrl); xhr.send(); }, 1000); // 必要に応じてタイムアウトを調整します }); } });


